Vistas of mathematical illustration
Summary:
Seeing is believing. There are three axes of mathematical illustration: A picture can exposit mathematical ideas, aid in the discovery of new math, or be an avenue for artistic expression. We will take a whirlwind tour though several areas of the field, and get acquainted with the varied goals, themes, mediums, and lots and lots of pictures. Many contributors to this field have little formal math training. All you need is a new perspective and some visual flair.
Presented at:
- OURFA2M2: Online undergraduate research fair for the advancement and alignment of marginalized mathematicians.
🔗 Link to file
Link to slideshow, with animations and everything.
References:
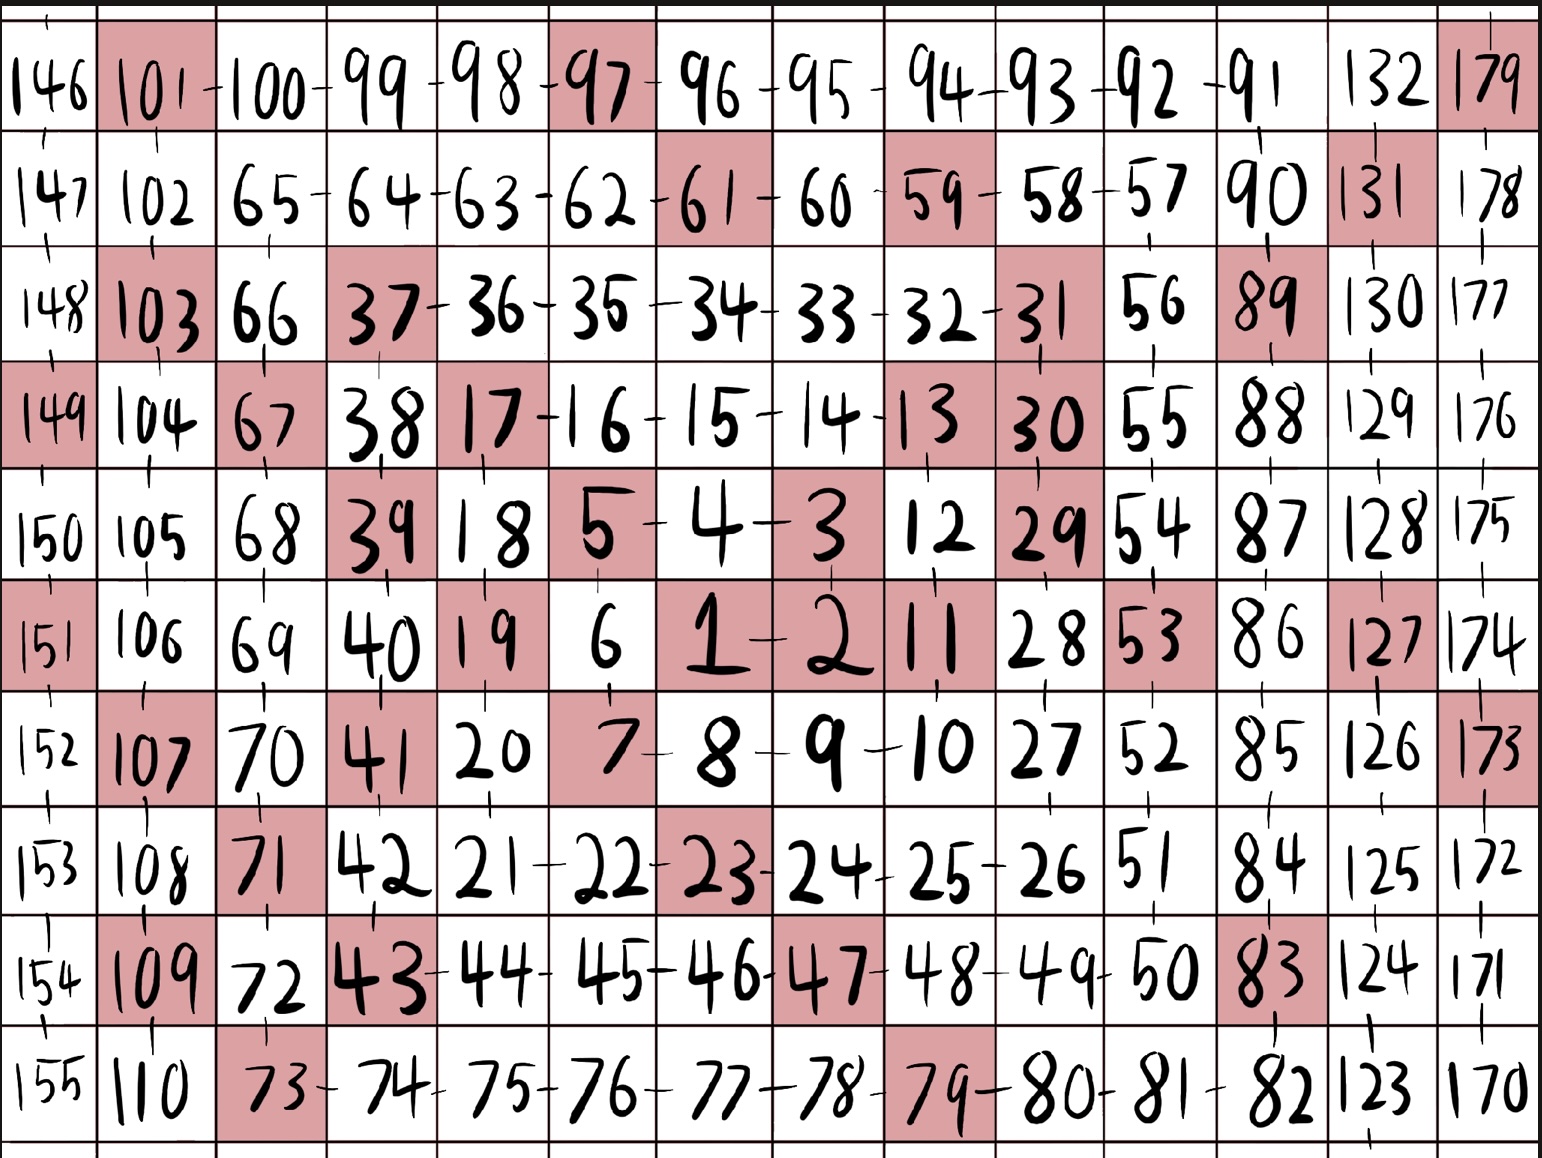
- Online generator for random domino tilings in the aztec diamond, illustrating the Artic circle theorem: Aztec diamond generator
- Creative coding resources:
- p5js: A beginner-friendly language designed for easy drawing with code.
- The coding train: Tutorials about creative coding and visualization in processing
- OpenProcessing: Site compiling
- Iterated function systems:
- Tobin’s tetrahedron: Rotate a 4-point iterated function system to make an illusory Sierpinski tetrahedron.
- Iterated function system explorer
- geometry labs
- Outside in: A video about turning a sphere inside out, produced at the first geometry lab.
- Geometry labs united: A collection of labs across various universities, which focus on experimental mathematics and visualization. A good place to find kindred spirits
Illustrating mathematics: An organizing website for the community of mathematical illustrators. Includes a link to the illustrating mathematics discord server,